
Science behind mySmartBlood
Smart Blood Analytics Swiss SA specializes in providing an artificial intelligence machine learning model that enables healthcare professionals to quickly and accurately gain information about their patients by providing the most likely diseases, based solely on blood test results. Recently we have developed the mySmartBlood application which is an in vitro diagnostic medical device, intended to provide information to the lay person concerning their medical conditions using the results of standard blood tests. In this article we describe the science behind the mySmartBlood app.
To achieve its purpose, the mySmartBlood app uses a machine learning model which uses a complex decision-making approach that considers a user’s blood parameters to suggest the most likely diseases. The model uses 52 blood parameters as well as the user’s age and biological sex in order to produce a list of the most probable diseases given the user’s blood test results. The model can distinguish between 426 different diseases that belong to 91 different groups of diseases from various fields of internal medicine including toxicology, endocrinology, gastroenterology, cardiology, hematology, nephrology, pulmonology and rheumatology.
The model was developed, evaluated and certified prior to the release of the mySmartBlood app and has been “locked”. This means that the model itself does not learn further or change its behavior in any way. It was developed using state-of-the-art supervised machine learning algorithms, leveraging a large, curated database of diagnosed patients from the different fields of internal medicine. Even though there are hundreds of different blood parameters known to modern medicine, mySmartBlood uses only 52, since we wanted to make mySmartBlood available to as many users as possible without affecting performance. For this reason, we first ranked the importance of each blood parameter (using parameter-importance analysis techniques) and then selected the highest-ranked parameters for which the blood tests are also non-invasive and generally accessible to the public at testing laboratories.
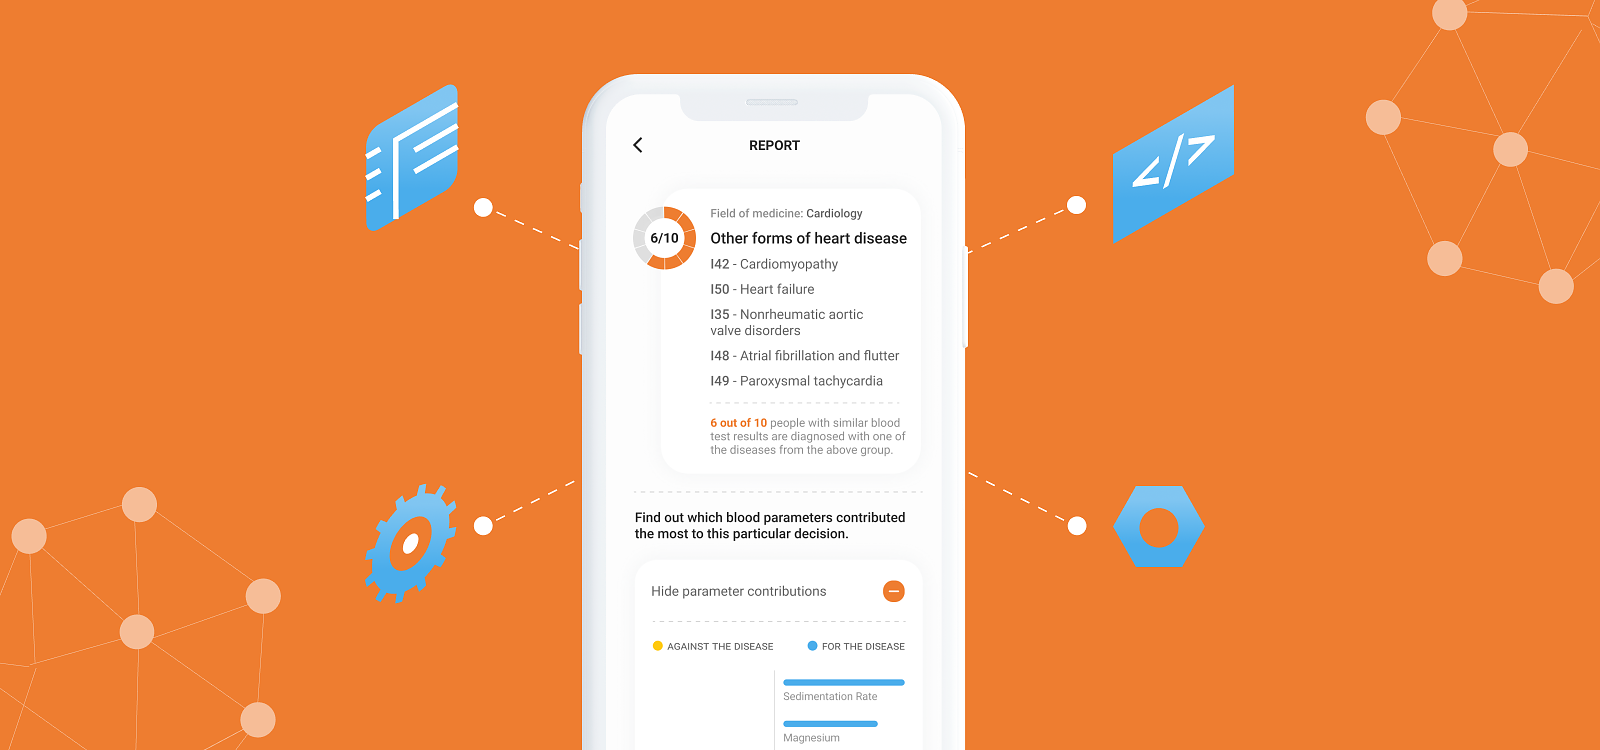
The next big decision during the development of mySmartBlood was how to communicate the model results to the user. Since our model can output a list of the most probable diseases, we decided to group those disease according to the International Statistical Classification of Diseases and Related Health Problems (ICD) group codes and include in the final mySmartBlood report a maximum of five of the most likely groups of diseases, as well as the most relevant diseases for each predicted group. In this way, even users with chronic diseases can still obtain some useful information about their possible comorbidities, which are other conditions that often occur with the primary condition.
Performance of the mySmartBlood model was evaluated on a separate set of test cases that were diagnosed by physicians with the help of blood test results as well as other diagnostic tools. The test set was strictly reserved for performance evaluation purposes and was not used during development of the mySmartBlood model. The test cases were chosen randomly but stratified, meaning that the prevalence of the diseases within the test set was roughly the same as in the dataset used for development. Performance evaluation results are characterized using a diagnostic accuracy of a maximum of five of the most likely groups of diseases with the 95% binominal confidence intervals. The accuracy is defined as a ratio between the number of correctly classified cases and the number of all cases in a test set. A correctly classified case is defined as a case for which a group of diseases that has been diagnosed by a physician is also present in the mySmartBlood report. In this way the accuracy represents how often the mySmartBlood report would indicate the correct group of diseases. The accuracy of the mySmartBlood model on this test set is 85 % ± 1 %.
If you are eager to find out more about the mySmartBlood you are welcome to read the Instructions for use and download the application from Google Play or App Store.